Meet Kazandra Zelaya
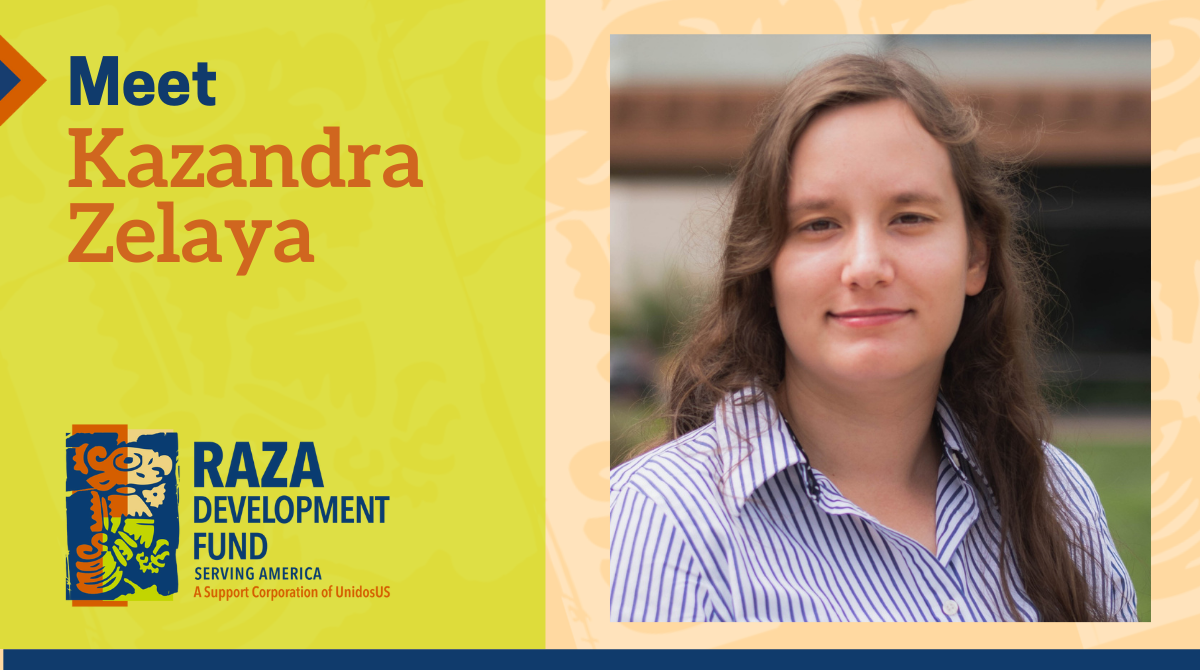
In October of 2021, RDF cheered as we welcomed Kazandra Zelaya, RDF’s Research and Data Analyst for Community Impact Assessment into our Familia. After graduating with a bachelor’s degree in environmental analysis & classics from Claremont McKenna College, Kazandra first joined us as a temporary data visualization specialist last year. Now we are proud to have her for a full-time permanent position.
As she works with a new kitten Shinobu, by her side, Kazandra has been instrumental in creating new ways for RDF to use data to show our impact in communities. Her enthusiasm and expertise for the work is evident as she demonstrates the capabilities of data maps.
“The visualizations and mappings that Kazandra creates adds a substantial backdrop to the qualitative data we collect. These maps provide a quantitative understanding of how we can better support the creation of opportunities through our financing of community development projects,” says Kazandra’s supervisor Eugenia Vivanco, RDF’s Community Impact & Funding Director.
Get to know Kazandra as we share a glimpse into our newest expert with a Q&A.
Where are you from?
I grew up in Phoenix, the Maryvale area.
However, my family and I have spent a lot of time traveling to El Salvador, where my dad is from. We used to go to all the archaeological sites because my dad was afraid that we would lose the history and culture of El Salvador while living in the U.S. I lived there for an entire year with my grandparents when I was younger.
What do you enjoy most about working at RDF?
This is a great match for me because I do what I enjoy, data and visualizations. There’s a lot of freedom and openness here to explore new tools and ways of measuring data.
With RDF, I am not just working for an entity, I’m supporting a greater purpose supporting Latino and low-income communities – creating access to capital in areas that wouldn’t have access to it. It’s fulfilling to have a greater purpose for my work.
Plus, I really like the culture. Everyone is nice and welcoming. When I attended the all-staff retreat, I had only worked here for two months, and I was very nervous because I hadn’t really met many of the staff. But by the end of it, it felt very comforting.
What has been one of your favorite projects thus far?
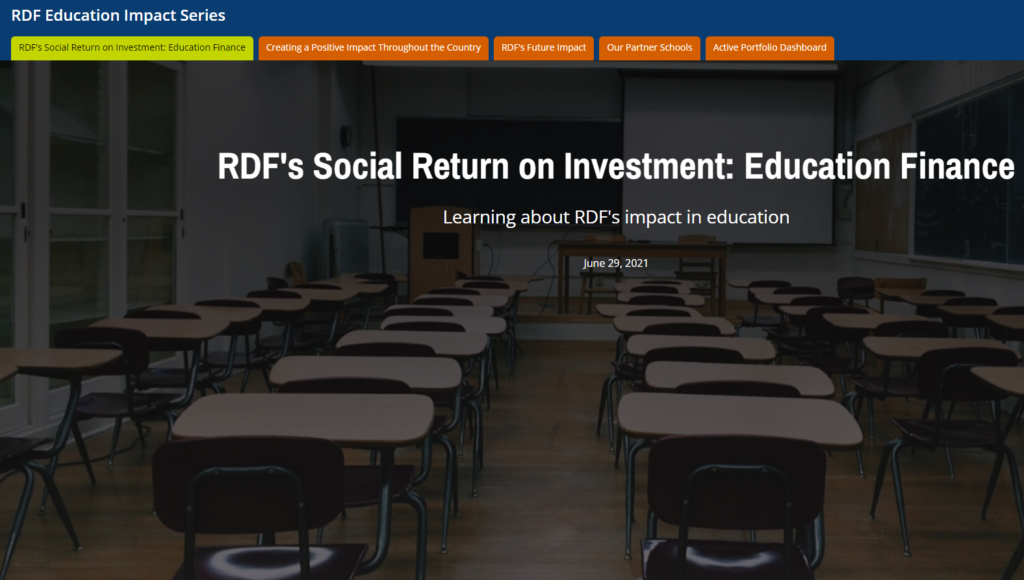
I really like the different projects I get to be a part of and help create. Recently, I worked on our Education Impact Series that shows RDF’s impact in the education community across the country. On this dashboard we can see how many loans RDF has provided while looking at the context of the communities that financing was in. We can look at the high school graduation rates in the area, how many homes have access to the internet, etc., to truly show the impact of our investments.
It’s great to understand what’s happening in the areas we have invested in, as well as to see where we hope to invest in order to confirm our suspicions of where the need truly lies.
This was an exciting project. There were a lot of little things to convey, but everyone that was involved with it from the translator as well as the rest of the Communications team knew what needed to be done. We were able to create different maps and then duplicate them to translate them in Spanish. I had the opportunity to get to know different staff members throughout this process, which doesn’t happen with smaller projects.
Why are data maps beneficial to RDF and other related organizations?
The big benefit of using maps is being able to truly understand what communities look like from a place-based perspective. When information is broken down in various localities, unique patterns may emerge that wouldn’t have been emphasized otherwise. Maps greatly assist in understanding situations and providing a richer narrative than bar charts alone can provide.
For example, I recently put together a map of housing in South Phoenix. With different color tones and overlays we can show median income of the renters versus the homeowners in the area highlighting the Latino population. We can then pinpoint where RDF’s new headquarters is in relation to the income data to see if the organization will reside where its community needs it the most.
How do you continue to challenge yourself personally and professionally?
Right now, I’m working on a data engineering certification from IBM that includes big data and machine learning – a great way for me to build on my current skills. After I complete that in eight months, I will look at my possibilities for graduate school.
Additionally, I have been challenging myself mentally and physically by training to run a 5K. I hate running. It’s the one sport that I haven’t really gotten along with very well. I signed up though as a challenge to myself to be able to run longer. My siblings are big on running and they are helping to run with me. It’s a good little activity for us.
We are excited to have you, Kazandra!